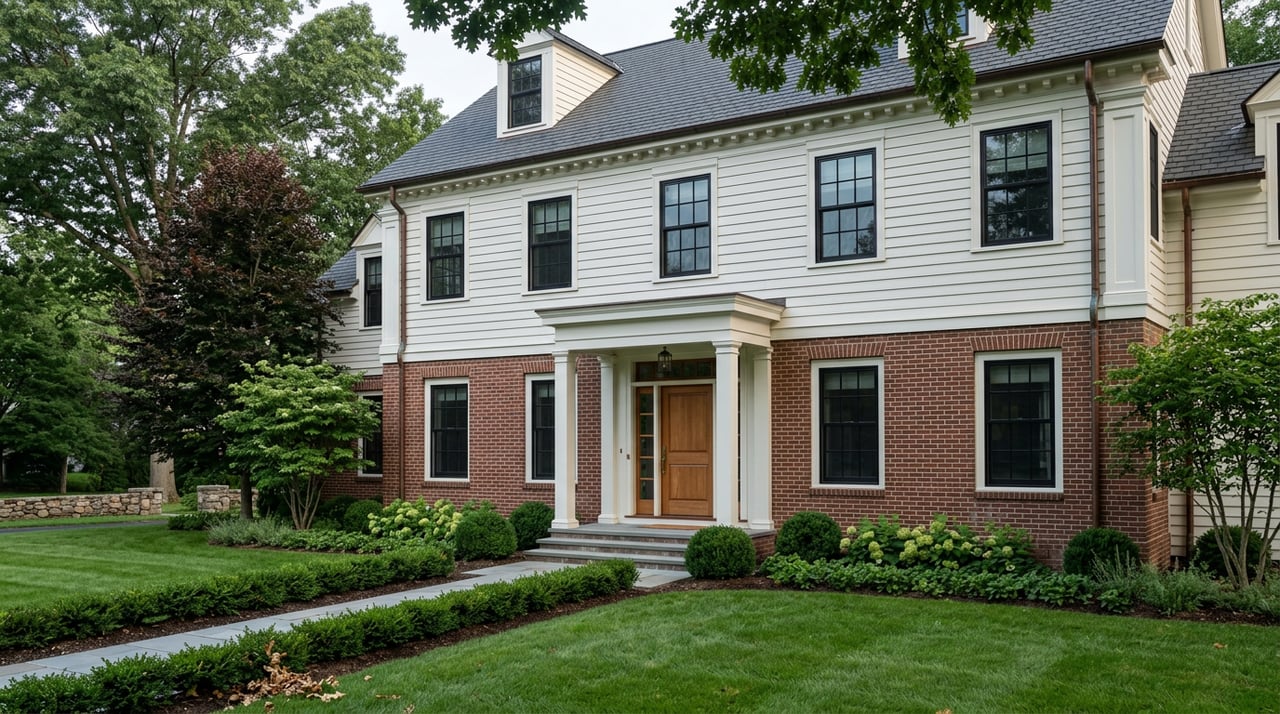
Both numbers come from the same market, in the same stretch of months. Over the three months ending in May 2026, Wayland's median sale price climbed to $1.2 million, up 28.9 percent from the same period a year earlier. Over that identical window, the median sale price per square foot fell to $410, down 16 percent year over year. One number says the town got dramatically more expensive. The other says the value of a square foot of Wayland real estate actually declined.
Neither number is wrong. What's wrong is reading either one as a simple story about appreciation. Wayland's market right now is thin enough that a handful of transactions can swing the headline figure without telling you anything about what your money buys.
The Math Behind the Contradiction
Start with volume, because volume is the whole explanation. Wayland recorded 7 home sales in March 2026, a jump of 250 percent from the same month the year before, according to data reported by Patch from the Massachusetts Association of Realtors. That same month, the number of active listings fell to just 11, a 50 percent decline from a year earlier. March's median sale price landed at $1,401,000, up 11.4 percent year over year.
Now look at how the picture shifted as the year went on:
| Period | Homes Sold | Median Sale Price | Price per Sq Ft | Change vs. Prior Year |
|---|---|---|---|---|
| January 2026 | 8 | $1.3M | $418 | Price +10.1%, $/sqft +0.2% |
| March 2026 | 7 | $1,401,000 | Not reported | Price +11.4% |
| Three months through May 2026 | 52 sold in May alone | $1.2M | $410 | Price +28.9%, $/sqft -16.0% |
In January, price per square foot barely moved, up two-tenths of a percent, even as the median jumped double digits. By May, the gap had widened into a full reversal: the median up nearly 29 percent, the per-square-foot value down 16 percent. That is not a market smoothly appreciating. That is a market where the mix of homes closing each month has been drifting toward larger, pricier properties, pulling the median along with it while the underlying cost of square footage holds flat or slips.
Listing data from June 2026 points the same direction. The median list price that month was $1.19 million, down 4 percent from May, with price per square foot at $413, down 13 percent year over year, and homes spending a median of 31 days on the market. Whichever slice of the year you look at, the same pattern holds: the top-line price keeps climbing while the per-square-foot figure lags or falls.
Why Eleven Listings Change Everything
A median is the value in the middle. When 50 homes sell in a month, one unusually large sale barely moves it. When 7 or 8 homes sell, one unusually large sale can carry the whole figure.
Wayland's Claypit Hill neighborhood illustrates why this matters. Widely regarded as the town's premier residential area, Claypit Hill sits north of Route 20 and south of Glezen and Moore Roads, with larger lots set back on tree-lined streets. The neighborhood's housing stock ranges from modest homes needing updates around $1 million, to a majority priced above $1.5 million, up to expansive properties topping $2.5 million. Many of the older homes trace back to a builder known locally for constructing more than 400 larger-scale capes and colonials across Wayland and Weston in the 1950s and 1960s, homes still sought after today and often expanded or rebuilt.
Add in what's coming: in January 2026, the Wayland Building Commissioner issued a formal written determination confirming that a rare .85-acre parcel on Dudley Road, assembled from 12 original subdivision parcels, is buildable for a single-family home, complete with water views and private dock rights. A property like that, once it closes, is exactly the kind of single transaction capable of pulling a monthly median well above what a typical non-waterfront home nearby would command per square foot. That's the mechanism in miniature: an outlier sale in a thin market doesn't just add one data point, it can define the month's headline number.
Compare that to Happy Hollow, a neighborhood built out mostly with capes, ranches, and colonials from the 1950s and 60s, prized for being within walking distance of Wayland's elementary, middle, and high schools. Prices there run from the $900s up to just over $1.5 million, a full tier below Claypit Hill's upper range. North Wayland, generally described as the area north of Claypit Hill, carries its own separate character and price band again.
Three neighborhoods, three different realistic budgets, one town-wide median. The $1.2 million figure that made headlines earlier this year doesn't describe any single one of them. It describes whichever properties happened to close.
What Actually Differs Neighborhood to Neighborhood
- Claypit Hill: larger, often wooded lots, a mix of mid-century capes and colonials alongside newer contemporary construction, prices from roughly $1 million for homes needing work up to $2.5 million and beyond for the largest properties.
- Happy Hollow: smaller-lot capes, ranches, and colonials from the 1950s and 60s, walking distance to all three Wayland schools, prices generally in the $900s to $1.5 million range.
- North Wayland: the area north of Claypit Hill, carrying its own distinct mix and price band separate from either of the above.
If you're comparing what a given budget buys in Wayland against what it buys in a neighboring MetroWest town, the neighborhood you're actually pricing matters more than the town-wide figure a portal serves up.
What This Means If You're Comparing Wayland to Other Towns
For buyers, the practical move is to stop anchoring on the median and start pulling recent closed comps for the specific size and neighborhood you're targeting. A $1.2 million median tells you almost nothing about what a 2,400-square-foot colonial in Happy Hollow sold for last month, because that transaction and a $2.5 million Claypit Hill estate get averaged into the same number. Price per square foot, tracked over several months rather than one, is the steadier yardstick, and right now it's telling a more restrained story than the median is.
For sellers, the tight supply is the more relevant fact. Eleven active listings in a town this size, as recorded in March 2026, means limited competition for whatever comes to market, and days on market across the year's data points have stayed fast, ranging from about 18 to 31 days depending on the month measured. A typical home priced appropriately for its neighborhood is still moving quickly. The headline appreciation number isn't the reason, though. The scarcity is.
A Few Common Questions
Is Wayland's market cooling? Not by the numbers available. Sales volume was up sharply in multiple months of 2026 compared with a year earlier, and homes are still closing fast. Supply is the tight constraint, not demand.
Why do the days-on-market figures differ so much between sources, 18 days versus 31? The measurement windows differ. Some figures track a trailing three-month average of closed sales, others track a single month of active listings. In a market this thin, those two methods can diverge noticeably from one month to the next.
Does a rising median mean I'll pay more for the same size house? Not necessarily. That's the exact assumption this data complicates. Look at price per square foot and at closed comps in the specific neighborhood you're considering before you take a headline median at face value.
Wayland's numbers this year reward a closer read, not a quicker one. If you're weighing this town against Sudbury, Weston, or another MetroWest option and want someone who can walk through the actual comps behind the headline, Rutledge Properties works directly with buyers and sellers across Wayland's neighborhoods, one agent from first conversation to closing. Work With Us to get the real numbers before you commit to a number you saw on a portal.